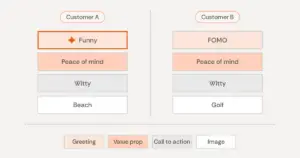
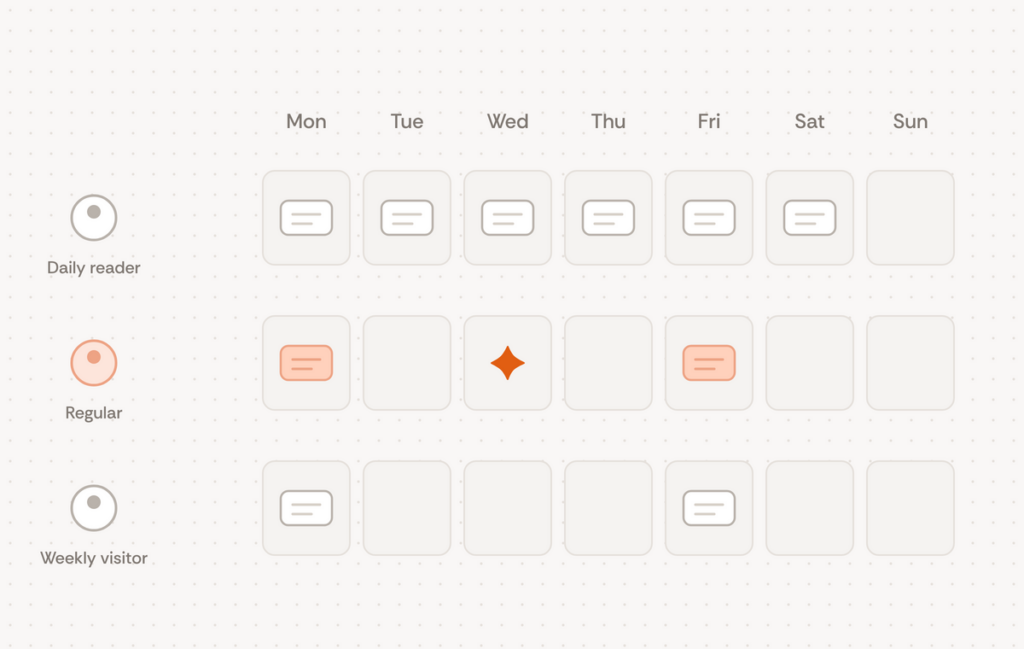
Picture two people using the same app. One opens it most days and is happy to hear from it daily. The other checks in about once a week and starts tuning out after the second message. Any single message frequency you choose for both of them will be wrong for at least one.
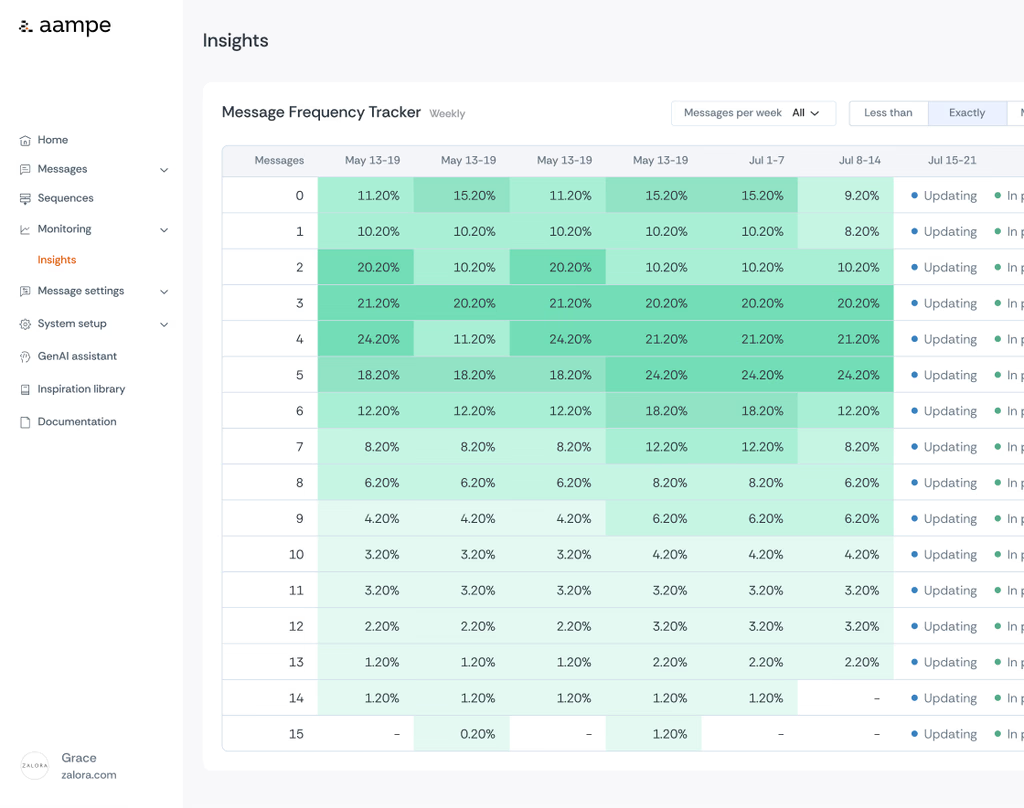
That is what turned up in one review of how many messages people received each week. At first glance it looked as if the agents had cut back, because fewer people were getting a message every day. A closer look showed some people getting more messages than before and others getting fewer. The agents had stopped treating message frequency as one setting for everyone and started learning it person by person
There is no single right message frequency
The question “how often should we message our users?” assumes there is one answer. A fixed cadence in a campaign tool forces one. People vary widely, though. Some will happily open something every day, and others want to hear from an app once a week or less. The only way to learn what one person tolerates is to vary how often they hear from you and watch what changes afterwards.
So the agents spread message frequency on purpose, in the same way they keep exploring uncertain options for content. Each agent compares what its user did after a message against what that user would likely have done anyway. Over time, that builds a picture of how much contact moves this person and how much starts to push them away.
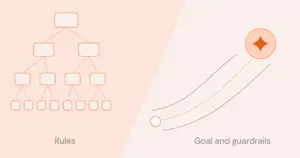
People still set the limits. Frequency caps and eligibility rules are hard rules, and the agents never cross them. Inside those limits, each agent decides how often to reach its user. Control sits with the team at the level of guardrails, and the agents handle the person-by-person adjustment.
A negative effect is information
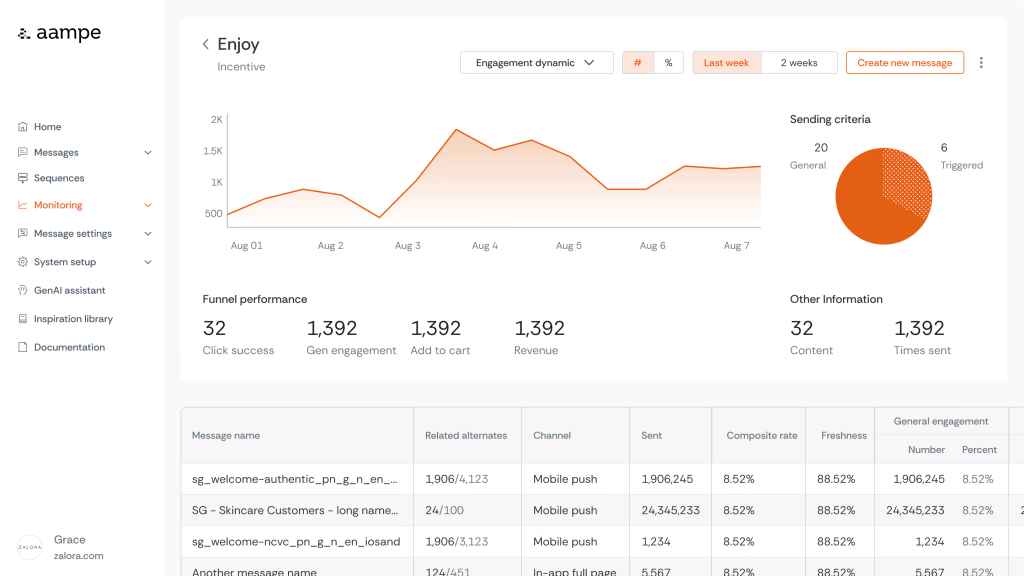
Some messages show a negative effect. A user was active in the app, received a message, and then engaged less than they otherwise would have. That can look like a message being ignored, but the message did change something, in the wrong direction. Reporting it plainly, with a clear definition of what negative means, is what lets a team and its agents act on it.
For the agents, a negative effect is as useful as a positive one. It tells an agent to try something else with that person, and sometimes the something else is sending less. A system that only counts clicks would never see this, because a message that quietly lowers someone’s activity produces no click to count.
Read opt-outs by who is leaving
On another account, a full-year review found one factor that consistently tracked opt-outs. That factor was the number of messages each person received. Volume per person clearly matters. The next question was who was opting out, and the answer was revealing. Many of the targeted audiences had already stopped transacting, or had never started.
The check the team proposed is simple. Compare how many of their last 30 days the people who opted out were active against the same measure for people who stayed. If the leavers were already inactive, more contact is the wrong lever, and better content for those users is the right one. A label report for that content library pointed the same way. Around nine in ten calls to action asked people to act directly, and very few invited them to explore. An inactive user who keeps receiving the same direct ask is an easy user to lose.
What to watch instead of an average
A single average hides almost everything that matters about message frequency. Look at the distribution, and track the share of users above and below each count over time. Watch whether contact rises for people whose activity responds to it and falls for people whose activity does not. Read opt-outs against the same audience’s baseline, alongside how active those users were before.
Expect the charts to be misread. People tend to read charts as “up is good, down is bad.” In a message frequency chart, a shrinking bar can be the system doing exactly what it should.
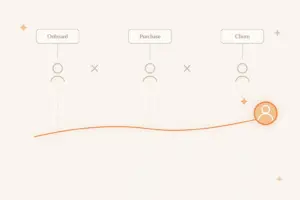
Schaun Wheeler wrote in 2021 that the goal is to keep a user willing to have that channel open. Per-user message frequency is how that works at scale. Each agent looks for the amount of contact its user will keep accepting, and keeps checking as that changes.
There is a short video on why there is no one-size-fits-all messaging frequency, and more conversations like this are on our YouTube channel.